Questions this chapter answers
- Our dashboards say personalization is working. How do we know it caused anything?
- Which metrics lie, and how do we pick ones that do not?
- Do we really need to hold customers back from the good version?
- How long before we know whether a change helped or hurt?
- Our system learns from customer behavior. Can that make it worse?
The short answer
Personalization is a targeting decision, and targeting decisions are very good at finding people who were going to act anyway. That is why the default report (people who got the personalized message converted more) proves almost nothing. The only defensible answer to "did it work?" is a comparison with a counterfactual: similar people, chosen at random, who did not get the treatment.
Teams that know, rather than hope, do four things. They measure outcomes, not proxies. They keep holdouts, including a small permanent one, so "compared to what?" always has an answer. They measure uplift (the change they caused) instead of response (the outcome they predicted). And they wait long enough to see slow effects, because some short-term wins are long-term losses.
Learning systems add one more trap: they train on behavior they caused, and can grow more confident and less useful at once.
The leader's test is simple. Ask for the holdout. If there is none, you do not yet know whether your personalization works; you know that it runs.
Larkspur Systems (a fictional composite company used throughout this handbook) put a model in charge of its nurture emails in the spring, writing subject lines per contact from product usage and role. Within six weeks the open rate had climbed from the low twenties to the mid thirties, and the marketing team presented the chart at the quarterly business review.
Two quarters later the sales team raised a different chart. Meetings sourced from nurture email were up, but the share that became qualified opportunities had fallen. More people were clicking "book a call"; fewer had a real reason to buy.
Nothing was broken; the model did what it was rewarded for. Part of the open-rate gain was not even human: Apple's Mail Privacy Protection downloads remote content, including tracking pixels, in the background whether or not the person reads the message, so some "opens" were machines [1]. The rest was curiosity, bought by subject lines that promised more than the email delivered. The metric had stopped measuring what it was chosen to measure.
That is the Proxy Trap, and every personalization program walks into it at least once.
An open rate is not an outcome
A proxy is a fast metric you hope moves with the outcome. Once a system is optimized against it, the relationship that made it a good proxy starts to break.
The economist Charles Goodhart put it in 1975: "Any observed statistical regularity will tend to collapse once pressure is placed upon it for control purposes." The line most people quote, "When a measure becomes a target, it ceases to be a good measure," is the anthropologist Marilyn Strathern's 1997 paraphrase, not Goodhart's own wording [2].
YouTube lived this at scale. In August 2012 the company explained that its discovery features "were previously designed to drive views. This rewarded videos that were successful at attracting clicks, rather than the videos that actually kept viewers engaged," and it moved to watch time [3]. Its 2016 recommender paper made the same point in engineering terms: ranking by click-through rate promotes deceptive videos the user does not finish, so the ranker predicts expected watch time instead [4]. Watch time is a proxy too. There is no perfect metric; choosing the proxy is a design decision that deserves the same scrutiny as the model.
Weights become policy. Facebook's 2018 "meaningful social interactions" metric, as internal documents reported by the Wall Street Journal described it, gave a like 1 point, a reaction or plain reshare 5, and a significant comment or reshare 30 [5]. Outrage provokes long comment threads. Nobody wrote "amplify anger" into the objective; the weighting did it. The metric, not the intention, decides what a system learns to do.
A metric you optimize is a metric you have stopped observing.
The only question is: compared to what?
Here is the sentence this chapter turns on: personalization selects people, and the people it selects were often going to act anyway.
A propensity model picks the contacts most likely to renew, and you send them a personalized message. They renew at 80 percent; everyone else at 55. The message may have done nothing. You chose the renewers; you did not create them.
The only way to separate selection from effect is a counterfactual: a randomly chosen group who were eligible and did not receive the treatment. Randomization is the one method that balances everything you did not think to measure.
It also protects you from intuition, including senior intuition. At Amazon, Greg Linden built a prototype that recommended items in the shopping cart. A marketing senior vice-president "was dead set against it," arguing it would distract people from checking out, and Linden was told to stop. He ran a controlled experiment anyway, and the "feature won by such a wide margin that not having it live was costing Amazon a noticeable chunk of change" [6]. The reverse is more common. Kohavi and colleagues report that most successful changes at large web companies move key metrics by fractions of a percent, and that at Bing only a minority of ideas improved the metrics they targeted [7][8]. You cannot tell which ideas work from the meeting. And when a result looks spectacular, apply Twyman's law: any figure that looks interesting or different is usually wrong [7]. A 40 percent lift from a subject line is more likely a logging bug or bot traffic than a discovery.
Hold some people back, permanently
A holdout is a random group excluded from a treatment so its outcomes stand in for "what would have happened." A mature program runs two kinds. A per-decision holdout asks a narrow question (does this renewal message beat the generic one, or beat sending nothing?) and ends with the test.
A global holdout answers the board's question: across everything we personalize, what did personalization add? A small share of customers, a few percent, receives the generic experience on every personalized surface for a long period. It is the only way to see the combined effect of fifty launches that each "won" their own test, including wins that cannibalize each other or add up to fatigue.
Netflix gave a clear public example of stating value as a counterfactual. In a 2025 paper, its researchers compared the recommender with simpler alternatives: replacing it with matrix factorization reduced engagement by about 4 percent, and replacing it with popularity-based recommendations reduced it by about 12 percent [9]. That is far smaller and more believable than the "more than $1 billion a year" figure the company offered in 2015, which was a retention-value self-estimate, not a measured revenue effect [10].
Holdouts cost something; show the cost as a range. If personalization lifts a decision's value by L and you hold back h of the population, the forgone value is roughly h × L × (the value flowing through that decision). With a 5 percent holdout and a true lift somewhere between 2 and 10 percent, you forgo between 0.1 and 0.5 percent of that decision's value. That is the price of knowing. The price of not knowing is running a program for years that may do nothing, or harm.
Size it with arithmetic, not instinct. Detecting a move in conversion from 2.0 to 2.4 percent (a 20 percent relative lift) with the standard 80 percent power and 5 percent significance needs roughly 21,000 units in each group. Larkspur has 40,000 accounts. If the outcome is an account-level opportunity, a 90/10 split leaves 4,000 in the holdout, too few for an effect that size. The honest options: measure a more frequent outcome, pool quarters, accept that only larger effects are detectable, or say the decision cannot yet be proven.
The holdout is the only customer who tells you the truth.
Measure the change you caused, not the outcome you predicted
Holdouts make a better targeting question possible: not "who is most likely to convert?" but "whose behavior does this action change?" Uplift modeling estimates that difference per person or segment. Radcliffe and Surry's four groups frame it [11]. Persuadables act only if treated. Sure Things act either way. Lost Causes do not act either way. Do-Not-Disturbs (sometimes called Sleeping Dogs) are less likely to act if treated. A response model targets the first two groups indiscriminately and cannot see the fourth.
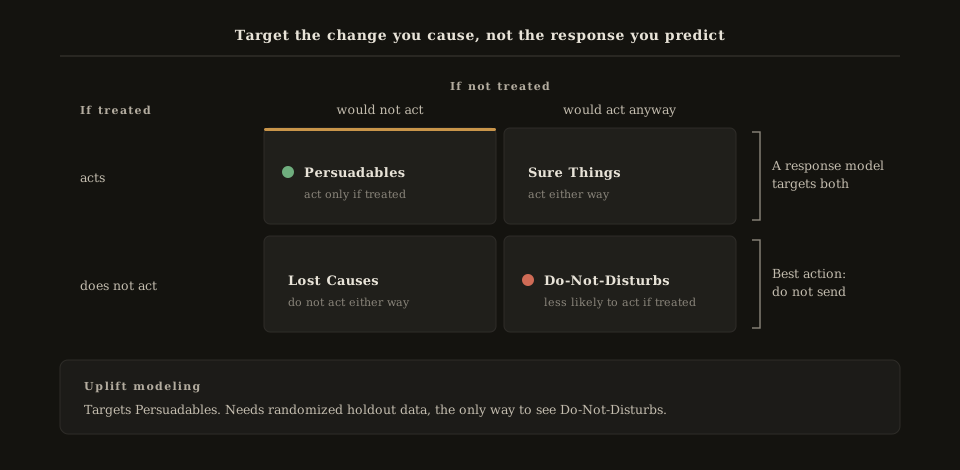
Figure 21.1. Only Persuadables are changed by the action; a response model cannot tell them from Sure Things or see Do-Not-Disturbs.
The fourth group is real. Retention activity can drive away some of the customers it targets [12], and Ascarza's field experiments found that targeting customers at highest churn risk was less effective than targeting those most sensitive to the intervention; they are not the same people [13]. Uplift models need randomized data to train on, one more reason holdouts are not optional. For Do-Not-Disturbs, not sending is the best action, and only a counterfactual can show it. Chapter 14 treats doing nothing as a decision; this is how you prove it was the right one.
Bandits learn faster and prove less
A bandit shifts traffic toward whichever option is winning while the test runs; a contextual bandit does it per person. Li and colleagues at Yahoo! showed the approach on the front-page news module, reporting a 12.5 percent click lift over a context-free bandit across more than 33 million events [14].
Bandits suit options that are many, short-lived, and cheap to be wrong about: subject lines, content blocks, send times. They are the wrong tool for proving a program's value, because they stop exploring what looks worse, and proof needs a stable comparison. They also optimize whatever reward you give them, which is the Proxy Trap at machine speed. So: bandits choose among variants inside a decision; holdouts measure whether the decision is worth making. Keep an exploration floor, a small share of traffic that is always randomized.
Generation makes the gap wider. In an illustrative campaign, 4 personas, 6 industries, 5 regions, 8 message themes, and 3 offers give 2,880 distinguishable contexts, and ten page zones with five eligible options each give 5^10, about 9.8 million possible compositions per context. That is expressive capacity, not experiment volume: at the roughly 21,000 people per arm the power calculation above needed, you cannot test one context's variants. Form a few strong hypotheses instead.
Short-term wins can be long-term losses
Most experiments run for days or weeks. Some effects take months, because people learn. At Google, Hohnhold, O'Brien, and Tang built experiments to measure "ads blindness," users changing their inherent propensity to click on ads based on the quality of ads they had seen [15]. Showing more ads raised revenue in a short test. Over months, users learned to ignore them. The team reduced the ad load on Google's mobile search interface by 50 percent over two years. It was, in the paper's words, "a substantially short-term revenue negative change," yet "the long-term revenue impact was shown to be neutral," with a clear improvement in user experience [15].
Personalized outreach has the same shape: frequency that lifts this month's replies can train contacts to ignore the sender next quarter. Long-running holdouts observe slow effects directly. Surrogate indices predict them: Athey, Chetty, Imbens, and Kang showed how to combine several short-term outcomes into an index that predicts the long-term one, estimating a job-training program's nine-year employment effect from the first six quarters of data [16]. Validate fast metrics against the slow outcome once, carefully, then use them with a known error bar.
The system trains on the behavior it caused
A personalization system shows people things, observes their response, and retrains on it. Items it never showed generate no clicks, so it concludes they are unwanted. Chaney, Stewart, and Engelhardt simulated this loop and found that recommenders trained on data from users already exposed to recommendations increase homogeneity without increasing utility [17]. The system becomes more certain about a narrower world.
The corrections are mechanical: log what was shown and its probability of being shown, so analysis can reweight; train partly on exploration and holdout data the system did not choose; track coverage alongside accuracy; treat rising model confidence with flat outcome lift as a warning.
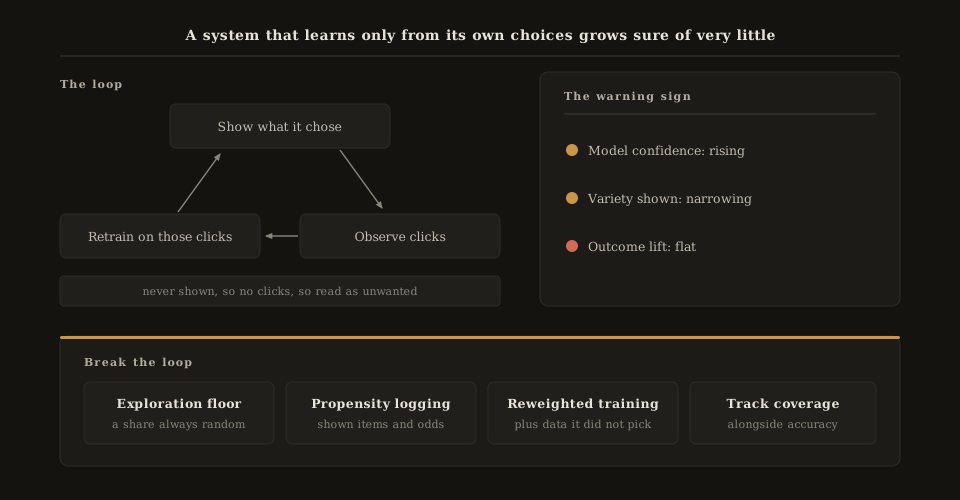
Figure 21.2. The Feedback Echo: a system trained on behavior it caused grows more confident about a narrower world.
Measure the layers separately
A business outcome is the product of several systems: identity, memory, retrieval, decision, generation, delivery. A single lift number cannot tell you which layer moved it, so measure each against its own standard. Retrieval: did the agent get the facts it needed? Decision: would a good operator have chosen it, including "wait"? Generation: were claims specific and true, or honestly general (Chapter 20)? Delivery: did it arrive once, on time? For pages, screens, and notifications, add the experience itself: task completion, time on task, and notification disables (Chapter 16). Only then: did the outcome move against the holdout?
The glue is the decision trace: for every action, what was known, which policy applied, what was chosen and why, what was sent (and from which template and guideline version), and what happened. With it, you can find that a "losing" variant lost because many of its messages fell back to generic copy on stale data.
The campaign report needs the same columns. In the engine I built, a trend ledger already tracks deterministic and semantic error rates, sample size, and verdict per version, so the question becomes "are we improving or regressing?" rather than "is today's sample fine?". The columns I would add next are the ones that explain an experiment: delivery rate, fallback rate, recovery rate, active template and guideline version, and conversion by context. Without them, a comparison cannot tell a weaker message from one that mostly never ran. And a count you could not read must show as unknown, not zero.
Chapter 20 describes the two learning loops I run in these engines, today as a human-supervised operator workflow [18]. The quality loop defines what is allowed; the performance loop (hypothesis, controlled test, measurement) optimizes inside it. An experiment can change strategy, never a factual guard. When a finding is classified, only one class, a performance hypothesis, goes to an experiment. A factual defect gets a guard and a regression test; a delivery defect gets retry and recovery. You do not A/B test whether a page may claim a contract the customer never signed.
Keep the two kinds of evidence apart. The ready-to-promote report that workflow is being extended to produce looks like this (illustrative numbers, not a result):
Cohort:      83 leads; 11 with unsupported relationship language
Proposal:    1 guideline update, 1 deterministic guard, 6 regression examples
Replay:      11/11 fixed
Held-out:    29/30 pass
Regression:  40/40 pass
Every line says the fix is correct and broke nothing. None says one more customer responded. A validation report answers "is it safe to ship?"; only a counterfactual answers "did it work?".
The Measurement Ladder
Each rung depends on the one below:
- Reporting. Counts and rates of what happened. Necessary, never proof.
- A/B tests. Randomized comparison of variants for one decision.
- Holdouts and incrementality. Personalized versus generic versus nothing, per decision and globally.
- Uplift. Targeting on estimated treatment effect per person.
- Continuous learning. Bandits and retraining inside guardrails, watched by a global holdout.
Most programs claim rung 5 while standing on rung 1.
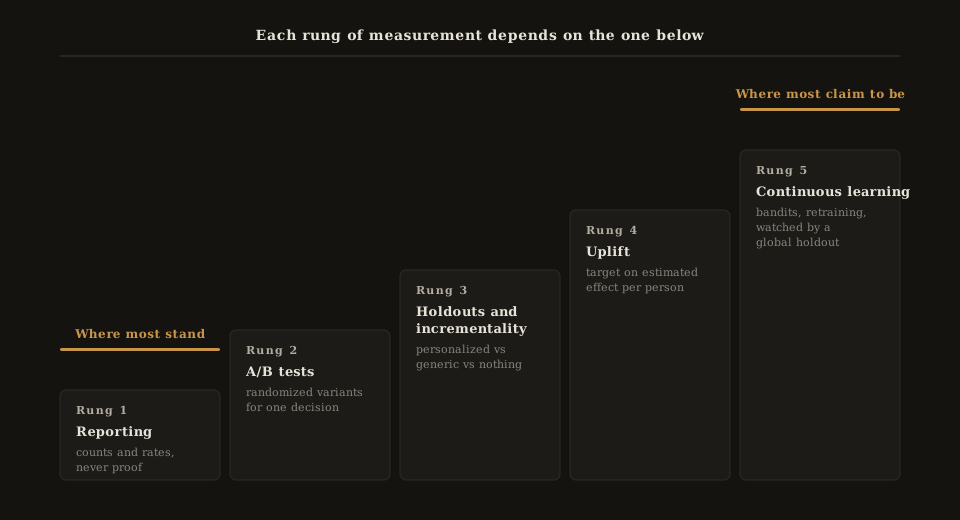
Figure 21.3. The Measurement Ladder: each rung depends on the one below, and most programs claim the top while standing on the bottom.
The KPI tree and the proxy checklist
Before launch, draw a tree: the root is the outcome you care about (qualified pipeline, retention, cost to serve), branches are drivers, leaves are fast metrics, and every leaf names the branch it should move. Then ask of every proxy: Can the system move it without moving the outcome? Can machines or privacy features inflate it? Has it been validated in a holdout? Which guardrail (unsubscribes, complaints, qualification rate) catches gaming? When is it re-validated?
What this does not do
Experiments tell you whether, not why; decision traces and cohort review fill that gap.
Randomization is not always available. Some decisions are too rare, some effects too slow, and in B2B the unit that matters (the account) is small in number. When the arithmetic says a decision cannot be proven, decide on judgment and label it as judgment. That is more honest than a p-value from an underpowered test.
I disagree with two popular shortcuts. The first is benchmark ROI. McKinsey's widely cited 2021 finding that personalization most often drives a 10 to 15 percent revenue lift [19] is a cross-company aggregate, not a randomized comparison of your program. It says where companies believe value lies. It is not evidence that yours works. The second is attribution dashboards that assign credit to every touch a buyer saw. They describe paths, not what would have happened without a touch.
Synthetic panels need their own caution. LLM personas asked how customers would react are useful as a pre-test for defects: confusing copy, a claim that reads as intrusive, a tone that misses a role. As a measure of lift they are not. When Verasight built personas from 1,500 real respondents and compared simulated with actual answers, average error ranged from 4 to 23 percentage points depending on the model, with weak subgroup estimates [20]. Peer-reviewed work finds synthetic samples show artificially low variance, which makes wrong answers look certain [21]. A rehearsal can catch mistakes. It cannot replace the customer. Chapter 3 reaches the same verdict for UX research (synthetic users draft; people validate), and adds the other half: a holdout proves what moved, and only qualitative research with real people finds why.
Finally, offline gains are not business gains: Booking.com and YouTube both reported offline model improvements that did not carry into live tests [22][4]. Ship to a holdout, not to a leaderboard.
At scale
With many teams running hundreds of personalized decisions, measurement becomes infrastructure.
Randomize at the unit of influence (see Patterns): contacts at one account talk to each other.
Coordinate experiments. Concurrent tests interact when several teams message the same person. One assignment log, one global holdout, and one contact policy stop fifty teams from each claiming the same renewal.
Protect the global holdout. Every quarter someone will ask to release it. Its cost is visible and its value invisible, which is why it gets cut. Put its size and end date in writing.
Make traces queryable. At millions of decisions, the trace answers "what happened to customers like this one?" in minutes, not in a data-science project.
Failure story: The Feedback Echo
Larkspur's content recommender picked the next nurture asset for each contact: guide, webinar, case study, product tour. Webinars had the highest click rate at launch, so the model showed more webinars, which produced more webinar clicks, which became the next training set. Within two quarters most contacts saw little else, and the model's offline accuracy rose every month.
An analyst compared it with a small random-exploration slice someone had left on by accident. Contacts in that slice saw a mix and were more likely to reach a product tour, the asset that best predicted a qualified opportunity. The model had not learned what contacts wanted. It had learned what it had been showing them.
The fix was ordinary: a permanent exploration floor, propensity logging, exposure-weighted training, and qualified opportunities in place of clicks. The lesson was not. A system that learns only from its own choices will eventually be very sure of very little.
Patterns
Permanent Global Holdout. Problem: many decisions each "win," but nobody can state the combined effect. Forces: holdouts cost visible value; leaders need a program-level answer. Solution: a small random share of customers gets the generic experience everywhere for a fixed, long period, with documented size and end date. Tradeoffs: forgone value (h × L); pressure to release it; needs volume to be powered.
Randomize at the Unit of Influence. Problem: treatment leaks between people who talk to each other, contaminating the holdout. Forces: contact-level tests have more units; account-level tests are cleaner. Solution: assign treatment where influence travels (account, household, buying group). Tradeoffs: fewer units, lower power: the honest price of a valid answer.
Quality Before Performance. Problem: optimization erodes accuracy or trust. Forces: performance gains show this week; trust losses surface later. Solution: separate loops with separate authority; correctness and policy define the feasible region, and optimization happens inside it. Tradeoffs: slower iteration on bolder variants.
Leader questions
- Where is our holdout, how big is it, and when was it last read?
- What outcome is our headline metric a proxy for, and has anyone validated the link?
- Are we targeting people likely to act, or people whose behavior our action changes?
- Which of our wins could be long-term losses?
- What does our system train on, and how much of it did the system not choose?
Build checklist
- KPI tree drawn, with every proxy linked to an outcome.
- Randomized assignment logged per decision, at the unit of influence.
- Per-decision holdouts (with a "send nothing" arm where plausible) and a documented global holdout.
- Power calculation before each test; underpowered decisions labeled as judgment.
- Guardrail metrics on every test; machine-generated opens excluded from outcomes.
- Exploration floor and propensity logging for every learning component.
- Decision traces for every action: known, policy, chosen, sent (with template and guideline version), outcome.
- Quality and performance loops with separate authority; only performance hypotheses become experiments.
Metrics to watch
- Incremental lift versus holdout on the root outcome, per decision and globally, with confidence intervals.
- Proxy-outcome agreement: how often a proxy win is also an outcome win.
- Exploration share and catalog coverage for every learning component.
- Long-term delta: lift at 90 days or more compared with lift at launch.
- Delivery and fallback rate per arm, so a losing arm can be told apart from an arm that mostly did not run.
Reader Q&A
We are B2B with a few thousand accounts. Can we test at all? Yes, within limits. Test frequent outcomes (replies, meetings), pool across quarters, accept that only large effects on rare outcomes are provable, and label judgment calls.
Is it ethical to withhold personalization from a holdout? The holdout gets your previous standard experience. Until you measure, you do not know the personalized version is better; sometimes it is not.
Can we use bandits instead of A/B tests? For choosing among variants, often. For proving that a program is worth its cost, no. Use both, and keep a holdout the bandit cannot touch.
How long should a test run? At least one full business cycle, longer for anything that could cause learning or fatigue. Decide the duration before launch, not when the chart looks good.
For your AIThis chapter's concepts, patterns and checklists as structured data. Paste it into your assistant.
chapter: 21
concepts:
  - name: Counterfactual
    definition: "What would have happened to the same kind of people without the treatment, estimated by a randomized control group."
  - name: Holdout
    definition: "A randomly selected group excluded from a treatment so its outcomes stand in for the counterfactual; per-decision or global."
  - name: Global Holdout
    definition: "A small, long-running random share of customers who receive the generic experience across all personalized surfaces."
  - name: Uplift
    definition: "The difference in outcome caused by treatment for a person or segment; distinct from the probability of responding."
  - name: Proxy Trap
    definition: "Optimizing a fast metric until it moves without the outcome it was chosen to predict."
  - name: Feedback Echo
    definition: "A learning system trained on behavior it caused, growing more confident about a narrower set of options."
  - name: Measurement Ladder
    definition: "Reporting, A/B tests, holdouts and incrementality, uplift, continuous learning; each rung depends on the one below."
decision_rules:
  - if: "a personalization result is reported without a randomized comparison group"
    then: "treat it as reporting, not evidence of effect"
  - if: "a metric is optimized by the system"
    then: "validate it against the root outcome in a holdout and add a guardrail metric"
  - if: "people in the same account or household influence each other"
    then: "randomize at the account or household level"
  - if: "a power calculation shows the effect cannot be detected at available volume"
    then: "use a more frequent outcome, pool time, or label the decision as judgment"
  - if: "a learning component trains on its own served outcomes"
    then: "keep an exploration floor, log serving propensities, and reweight training data"
  - if: "a change improves performance metrics but weakens a factual or policy guard"
    then: "reject it; quality defines the feasible region"
  - if: "a finding is a defect rather than a performance hypothesis"
    then: "fix it with a guard, guideline, or recovery and a regression test; do not run it as an experiment"
  - if: "a change passes replay, held-out, and regression validation"
    then: "treat it as safe to ship, not as evidence of lift; measure effect against a holdout"
assessment_questions:
  - "Do you have a holdout for your main personalized decisions, and a global one?"
  - "What is your headline personalization metric, and what outcome is it meant to predict?"
  - "Do you target on likelihood to respond or on estimated uplift?"
  - "At what unit (contact, account, household) do you randomize?"
  - "What share of your recommender or bandit traffic is randomized exploration?"
  - "Can you trace any single action to what was known, the policy applied, and the result?"
patterns: [Permanent Global Holdout, Randomize at the Unit of Influence, Quality Before Performance, Measurement Ladder, KPI Tree, Proxy Risk Checklist]
anti_patterns: [The Proxy Trap, The Feedback Echo, Response-as-Uplift, Survey ROI as Evidence, Offline Wins as Business Wins, Validation as Lift]
maturity_dimension: learning
References
- Apple, "Mail Privacy Protection & Privacy" and "Use Mail Privacy Protection on iPhone." https://www.apple.com/legal/privacy/data/en/mail-privacy-protection/ ; https://support.apple.com/guide/iphone/use-mail-privacy-protection-iphf084865c7/ios (accessed 2026-09-26).
- Goodhart, C. (1975), "Problems of Monetary Management: The U.K. Experience"; Strathern, M. (1997), "'Improving ratings': audit in the British University system," European Review 5(3).
- YouTube Official Blog (2012-08-10), "Why We Focus on Watch Time." https://blog.youtube/news-and-events/youtube-now-why-we-focus-on-watch-time/
- Covington, P., Adams, J., Sargin, E. (2016), "Deep Neural Networks for YouTube Recommendations," RecSys 2016.
- Hagey, K., Horwitz, J. (2021-09-15), "Facebook Tried to Make Its Platform a Healthier Place. It Got Angrier Instead," Wall Street Journal. House reprint: https://docs.house.gov/meetings/IF/IF16/20211201/114268/HHRG-117-IF16-20211201-SD012.pdf
- Kohavi, R., Longbotham, R. (2007), "Online Experiments: Lessons Learned," IEEE Computer 40(9). https://ai.stanford.edu/~ronnyk/2007IEEEComputerOnlineExperiments.pdf ; Linden, G. (2006), "Early Amazon: Shopping cart recommendations." https://glinden.blogspot.com/2006/04/early-amazon-shopping-cart.html
- Kohavi, R., Tang, D., Xu, Y. (2020), Trustworthy Online Controlled Experiments, Cambridge University Press. https://experimentguide.com/
- Kohavi, R. et al. (2014), "Seven Rules of Thumb for Web Site Experimenters," KDD 2014. https://exp-platform.com/Documents/2014-08-27ExperimentersRulesOfthumbKDD.pdf
- Zielnicki, K. et al. (2025, rev. 2026), "The Value of Personalized Recommendations: Evidence from Netflix," arXiv:2511.07280. https://arxiv.org/abs/2511.07280
- Gomez-Uribe, C., Hunt, N. (2015), "The Netflix Recommender System," ACM TMIS 6(4). https://dl.acm.org/doi/10.1145/2843948
- Radcliffe, N., Surry, P. (2011), "Real-World Uplift Modelling with Significance-Based Uplift Trees." https://www.research.ed.ac.uk/en/publications/real-world-uplift-modelling-with-significance-based-uplift-trees/
- Radcliffe, N., Simpson, R. (2008), "Identifying who can be saved and who will be driven away by retention activity," J. Telecommunications Management 1(2). https://stochasticsolutions.com/pdf/SavedAndDrivenAway.pdf
- Ascarza, E. (2018), "Retention Futility: Targeting High-Risk Customers Might Be Ineffective," Journal of Marketing Research 55(1). https://journals.sagepub.com/doi/10.1509/jmr.16.0163
- Li, L., Chu, W., Langford, J., Schapire, R. (2010), "A Contextual-Bandit Approach to Personalized News Article Recommendation," WWW 2010. https://arxiv.org/abs/1003.0146
- Hohnhold, H., O'Brien, D., Tang, D. (2015), "Focusing on the Long-term: It's Good for Users and Business," KDD 2015. https://research.google.com/pubs/archive/43887.pdf
- Athey, S., Chetty, R., Imbens, G., Kang, H. "The Surrogate Index: Combining Short-Term Proxies to Estimate Long-Term Treatment Effects More Rapidly and Precisely," NBER w26463. https://www.nber.org/papers/w26463
- Chaney, A., Stewart, B., Engelhardt, B. (2018), "How Algorithmic Confounding in Recommendation Systems Increases Homogeneity and Decreases Utility," RecSys 2018. https://arxiv.org/abs/1710.11214
- Taheri, H., "Building an Enterprise Personalization Engine," hamedtaheri.com (sections "Build two learning loops, not one" and "Validate every improvement against three sets").
- McKinsey (2021-11-12), "The value of getting personalization right, or wrong, is multiplying." https://www.mckinsey.com/capabilities/growth-marketing-and-sales/our-insights/the-value-of-getting-personalization-right-or-wrong-is-multiplying
- Verasight (2025), "Your Polls on ChatGPT." https://www.verasight.io/reports/synthetic-sampling
- Bisbee, J. et al. (2024), "Synthetic Replacements for Human Survey Data? The Perils of Large Language Models," Political Analysis. https://www.cambridge.org/core/journals/political-analysis/article/synthetic-replacements-for-human-survey-data-the-perils-of-large-language-models/B92267DC26195C7F36E63EA04A47D2FE
- Bernardi, L., Mavridis, T., Estevez, P. (2019), "150 Successful Machine Learning Models: 6 Lessons Learned at Booking.com," KDD 2019. https://dl.acm.org/doi/10.1145/3292500.3330744
This chapter is a working draft. If something is wrong or missing, tell me on LinkedIn.
Get chapters by email as they are revised